LINDA DENG
01 / 2026Data Product / Financial Analytics

MaaS Ecosystem
Profit Analyzer

An auditable analytics product that transforms monthly AI inference billing workbooks into supplier-level profit and margin insights.
Role
Product design · data logic · full-stack development
Stack
Flask · SQLite · Jinja · JavaScript · Chart.js
Context
CS50 final project · completed local prototype
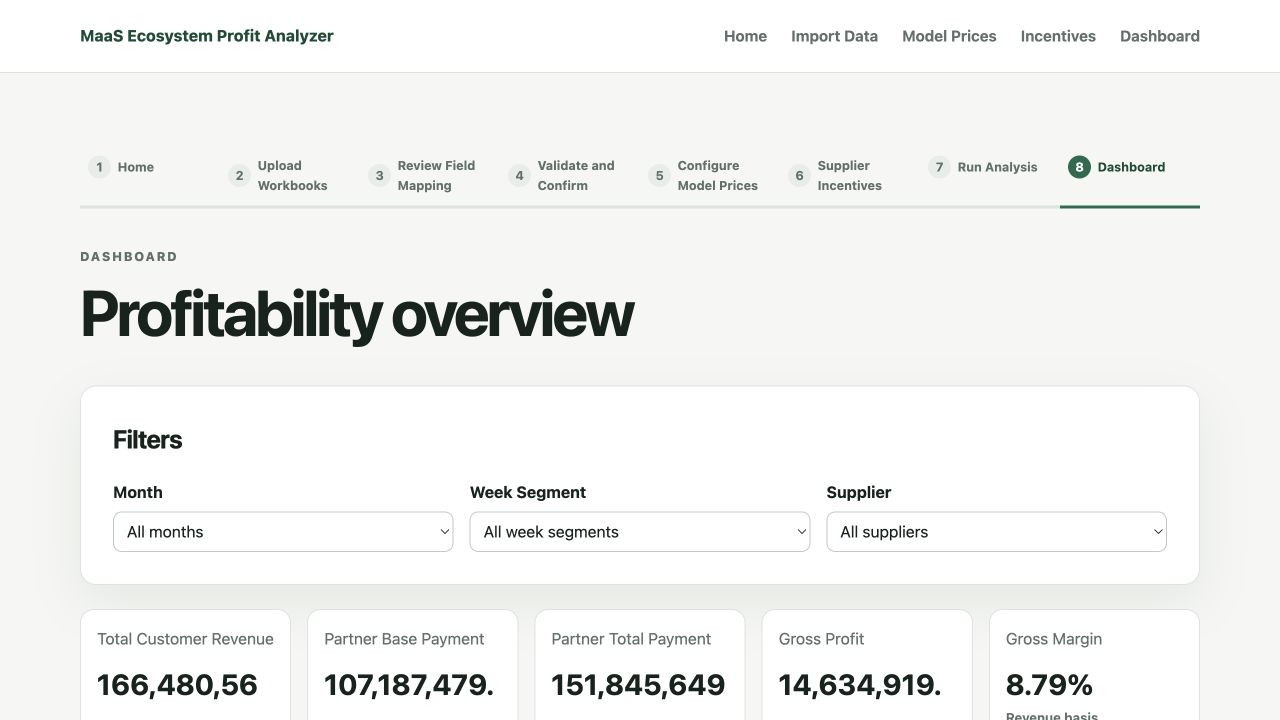
MaaS Ecosystem Profit Analyzer dashboard with filters and profitability KPIs
Decision surface — month, week-segment, and supplier filters connect directly to revenue, payment, profit, and margin.
PRODUCT QUESTION

Which supplier—and which week—actually generated profit or loss?

Monthly AI inference billing arrives as multiple workbooks. Revenue, model-specific costs, exchange settings, supplier payments, and weekly incentives do not share one reliable analytical surface. The product turns those fragmented inputs into a traceable sequence so an analyst can inspect both the final answer and the evidence behind it.

INPUT → DECISION
  1. 01Billing workbooksMonthly usage records
  2. 02Mapping + validationReview before confirmation
  3. 03Prices + incentivesModel and supplier rules
  4. 04Immutable analysisDeterministic calculation
  5. 05DashboardProfitability decisions
01 / AUDITABLE WORKFLOW

Every transformation remains visible before it becomes a result.

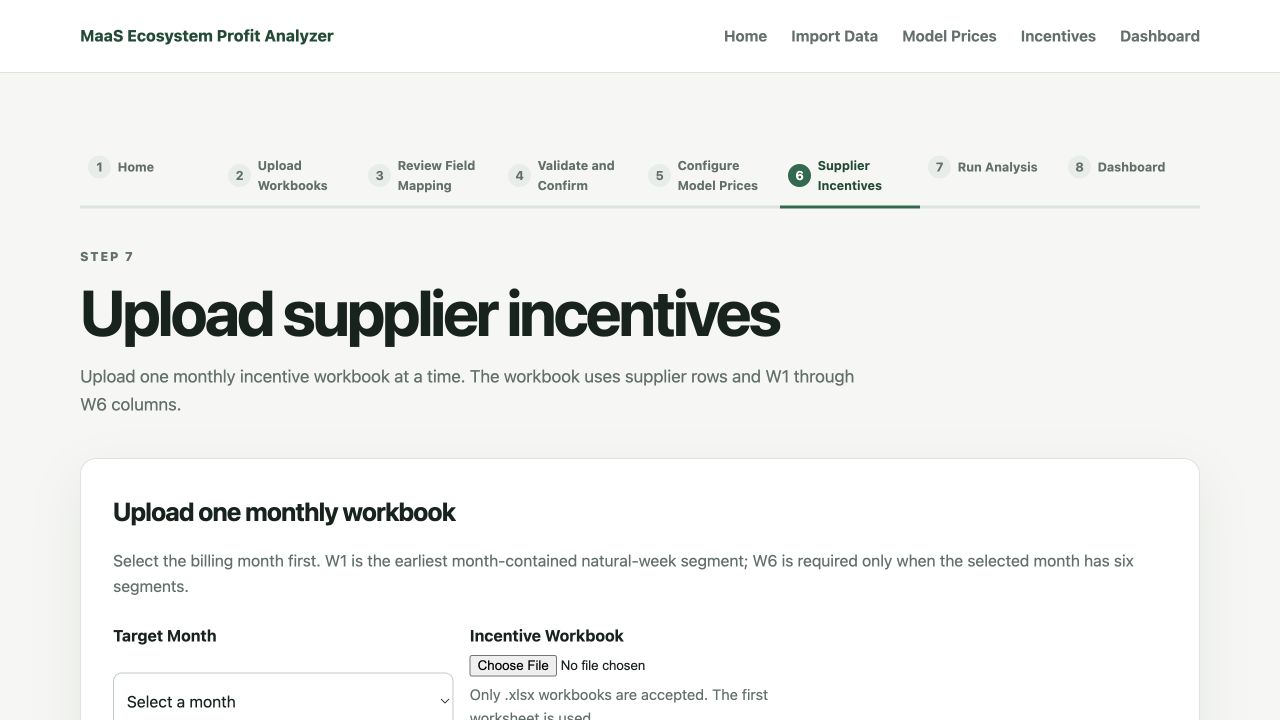
Workbooks enter independent staging batches. The analyst can review automatic field mapping, correct ambiguous headers, inspect valid, fallback, warning, and rejected rows, then confirm or cancel the import. Pricing and supplier incentives are configured only after the durable usage data is ready.
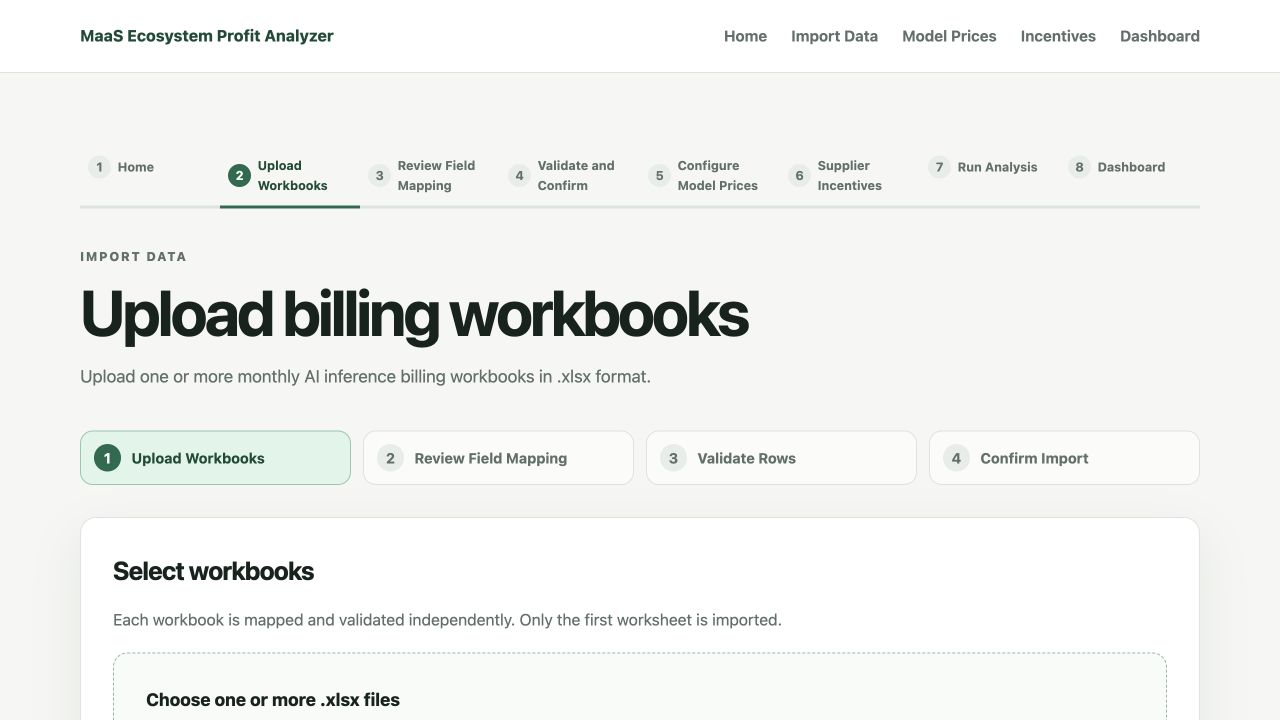
Workbook upload step in the MaaS analyzer
Upload — each workbook begins as an independent staged batch.
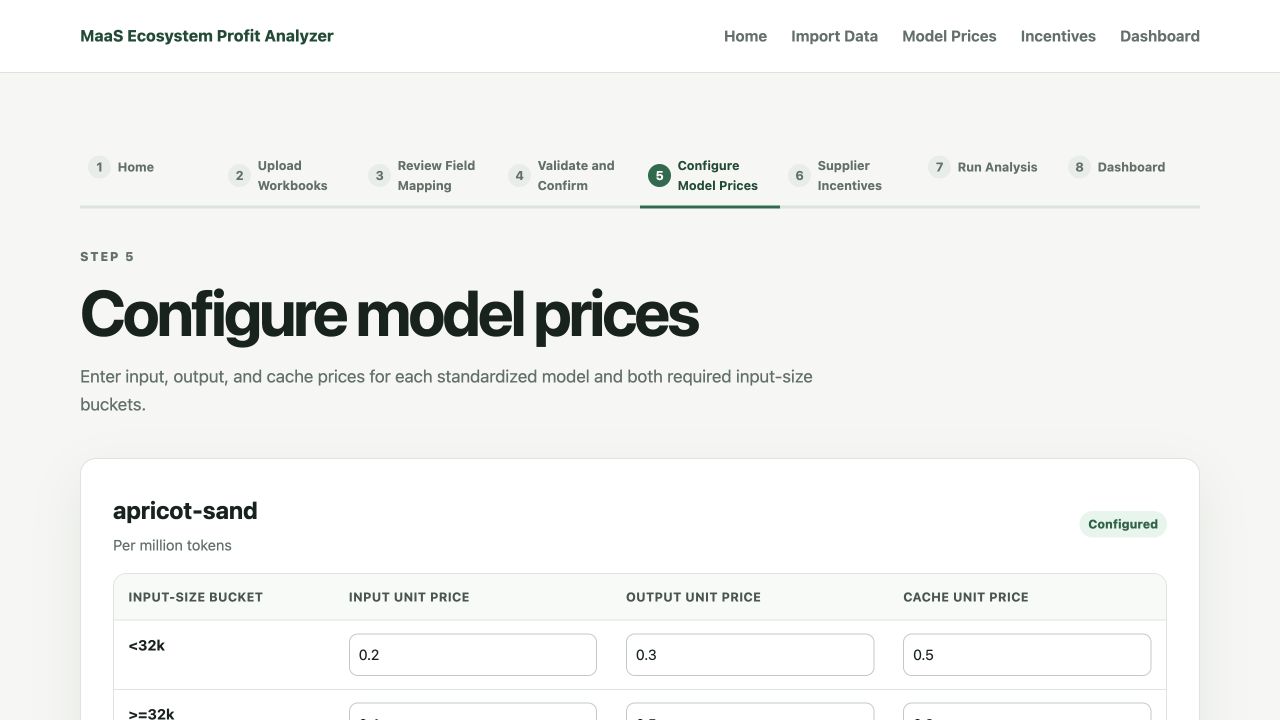
Model pricing configuration with two input-size buckets
Pricing — every standardized model preserves separate input-size buckets.
Supplier incentive input step
Incentives — supplier-week ratios complete the business inputs.
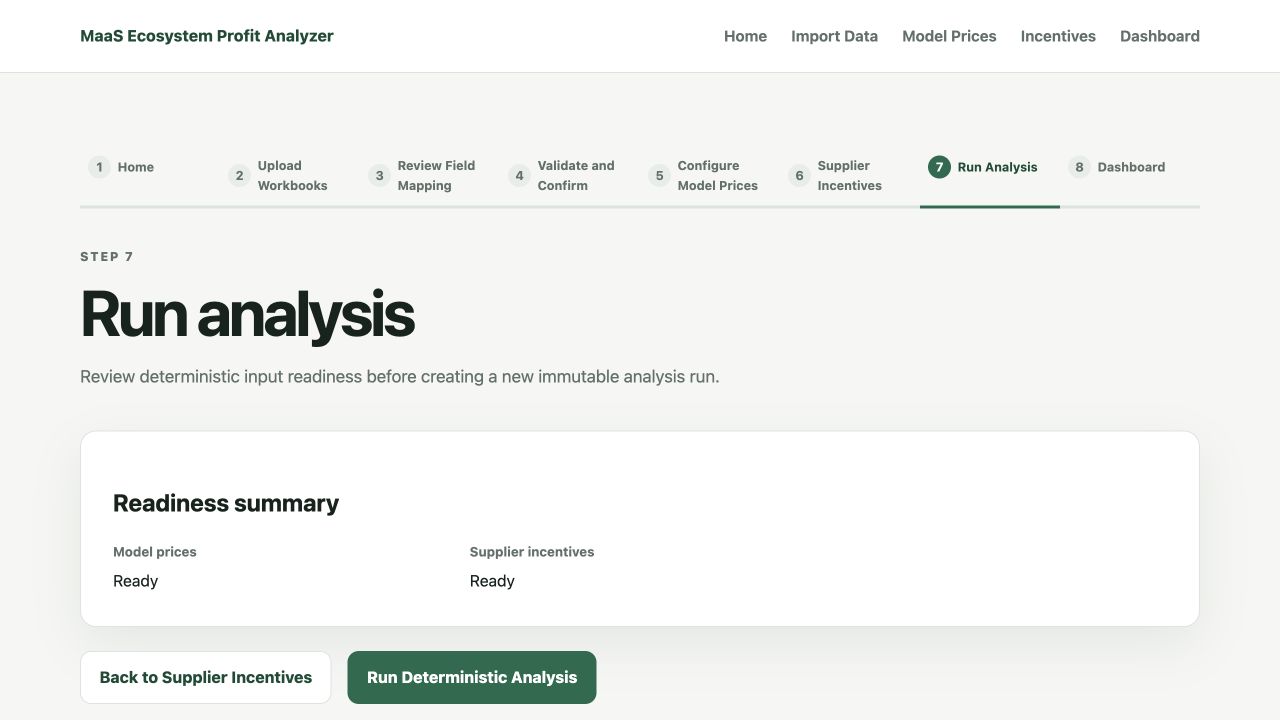
Analysis readiness page showing model prices and supplier incentives ready
Readiness — the run can begin only when its dependencies are complete.
02 / CALCULATION ENGINE

Calculate at the level where price differences still matter.

Usage is grouped first by month, week segment, supplier, model, and input-size bucket. Revenue and partner payment are calculated there before results roll up. This avoids silently applying a blended price to models and token buckets with different economics.

USAGEInput · output · cache tokens
+
MODEL PRICES<32k · ≥32k buckets
+
SUPPLIER RULESExchange · discount · incentive
=
PROFITABILITYRevenue − partner payment
SERVER-SIDE FINANCIAL RULEgross_profit = customer_revenue − partner_total_payment

Gross margin is calculated only when revenue is present and non-zero. The browser visualizes results; it does not recalculate them.

03 / DECISION SURFACE

One dashboard connects totals to suppliers, trends, exceptions, and data quality.

The latest non-stale completed run can be filtered by month, week segment, or supplier. Totals reconcile with the supplier table, while comparisons reveal where partner payments overtake customer revenue.
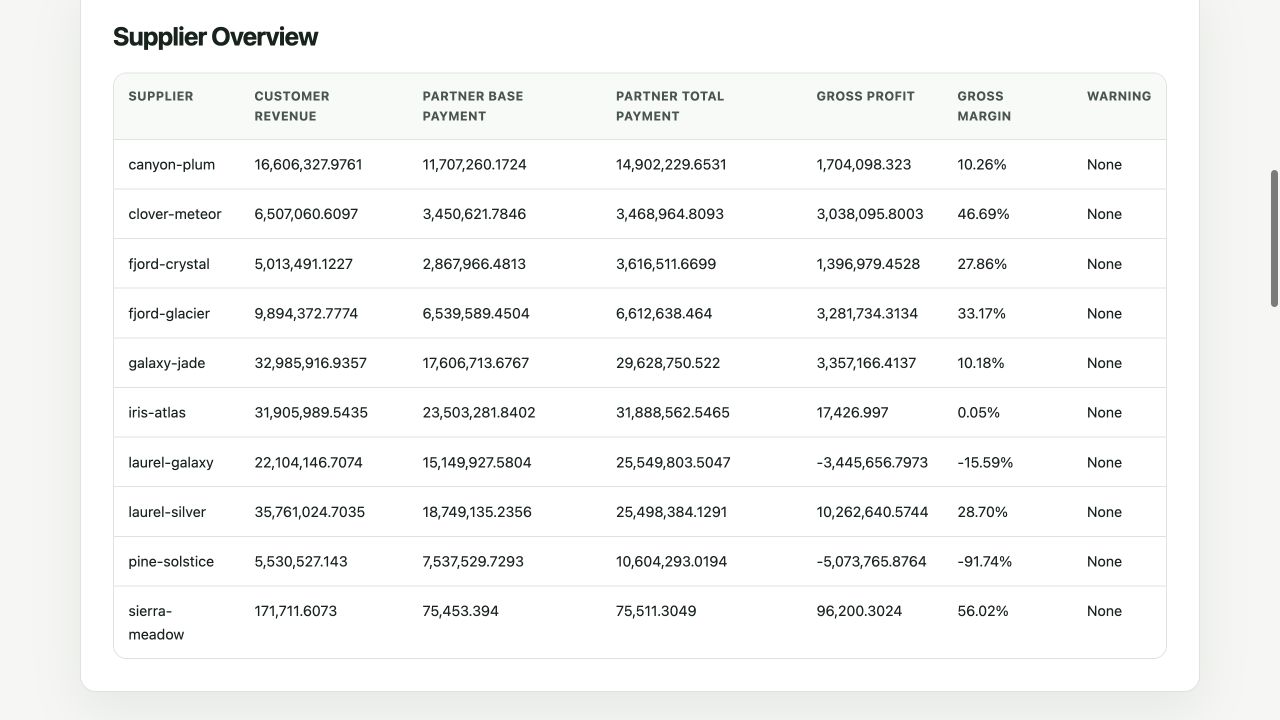
Supplier profitability table showing revenue, payment, profit, and margin
Supplier overview — the same calculation can be traced across ten anonymized suppliers.
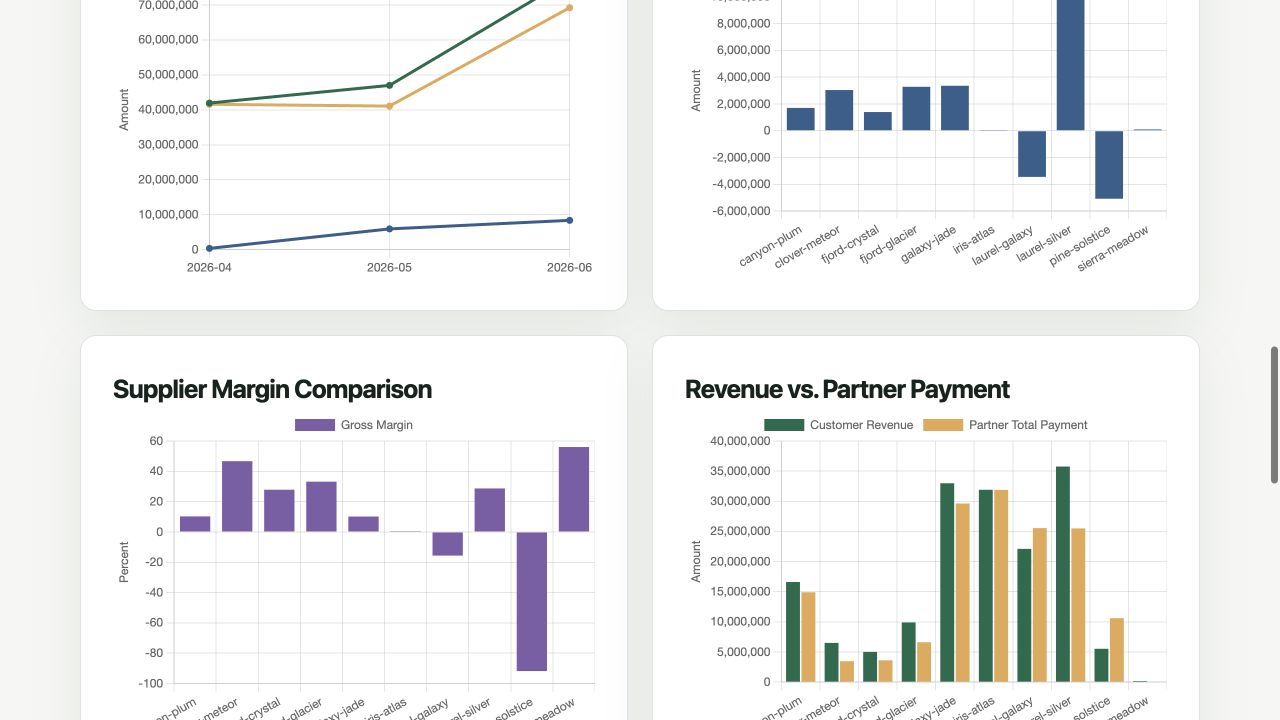
Supplier margin and revenue-versus-payment charts
Comparisons — profit, margin, revenue, and payment reveal different operational risks.
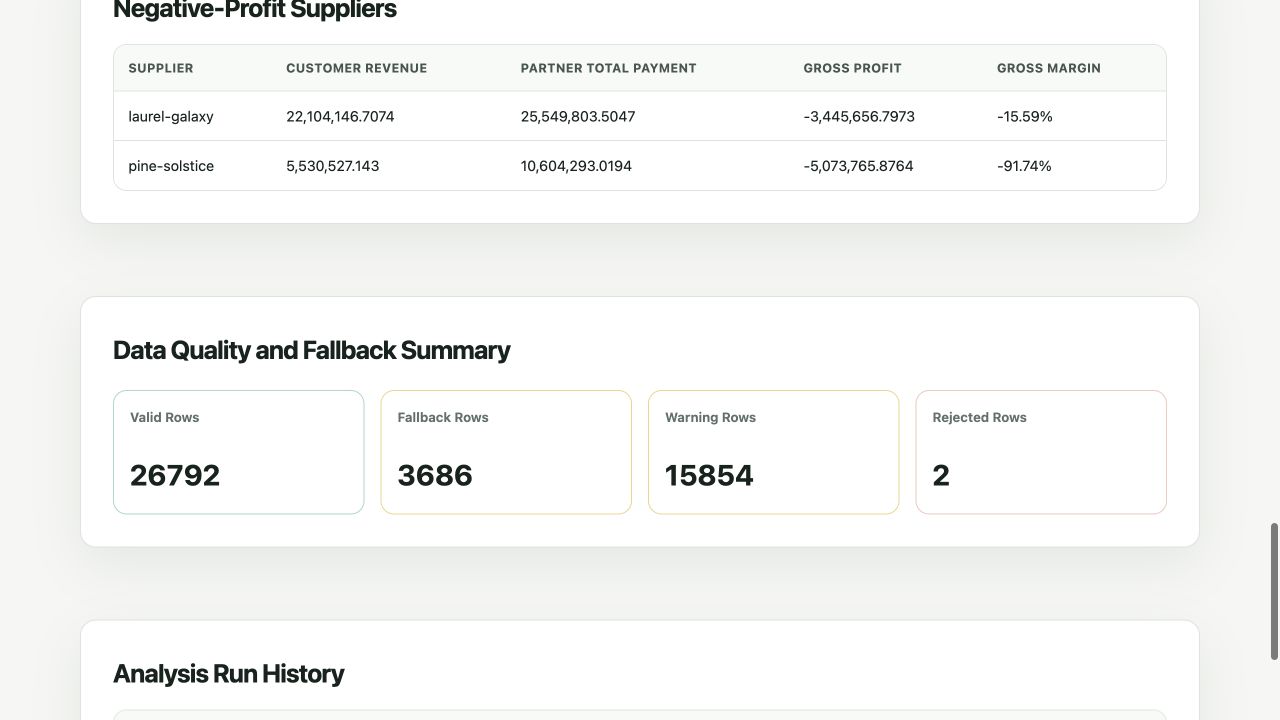
Negative-profit suppliers and data-quality summary
Exceptions + evidence — losses and quality counts remain part of the decision surface.
04 / SYSTEM ARCHITECTURE

A portable local stack keeps the workflow understandable and auditable.

Flask coordinates the multi-page workflow and server-side rules. SQLite stores staged imports, confirmed usage, configuration, immutable runs, and reconciled results. Jinja and JavaScript present those results, while Chart.js is limited to visualization.

01 / INTERFACE

Jinja + JavaScript

Workflow pages, filters, tables, and chart rendering.

↓
02 / SERVICES

Flask analysis layer

Validation, dependency guards, aggregation, and dashboard APIs.

↓
03 / DATA

SQLite

Staging · confirmed usage · inputs · runs · results · quality.

05 / RELIABILITY BY DESIGN

The product treats uncertainty as interface content, not hidden implementation detail.

01

Staged imports

Bad workbook data never enters durable records before review.

02

Manual mapping fallback

Inconsistent source headers remain visible and correctable.

03

Immutable runs

Completed results stay reproducible after later input changes.

04

Month-contained weeks

Supplier incentives never leak across calendar months.

05

Unavailable margin

Missing or zero revenue is not misrepresented as 0%.

06

Dependency guards

The workflow returns users to the earliest incomplete input.

PRODUCT POSITION

Trust is part of the product’s output.

The prototype is intentionally local-first: it can process financial workbooks without requiring a separate database service, and each completed run remains reproducible. A hosted production version would add authentication, role-based access, durable object storage, automated tests, observability, and controlled result sharing.

Watch product demo ↗
Back to Product Design ↗Next project — ALAN →