Museum
Reorganization
A continuous computational workflow that generates exhibition layouts, finds efficient routes, and measures visual qualities while preserving the museum’s freedom of exploration.
- Type
- Collaborative computational design research
- Site
- 21st Century Museum of Contemporary Art, Kanazawa
- Focus
- Generative layout · route finding · spatial analysis
Can optimization preserve, rather than reduce, spatial freedom?
The museum’s open plan lets visitors discover exhibitions at their own pace, but its irregular gallery boundaries and multiple entrances can also make orientation difficult. The research does not prescribe one ideal plan or one mandatory path. It connects spatial reorganization, route finding, and visual analysis so that curators can compare a family of layouts while visitors retain multiple possibilities of movement, view, and discovery.
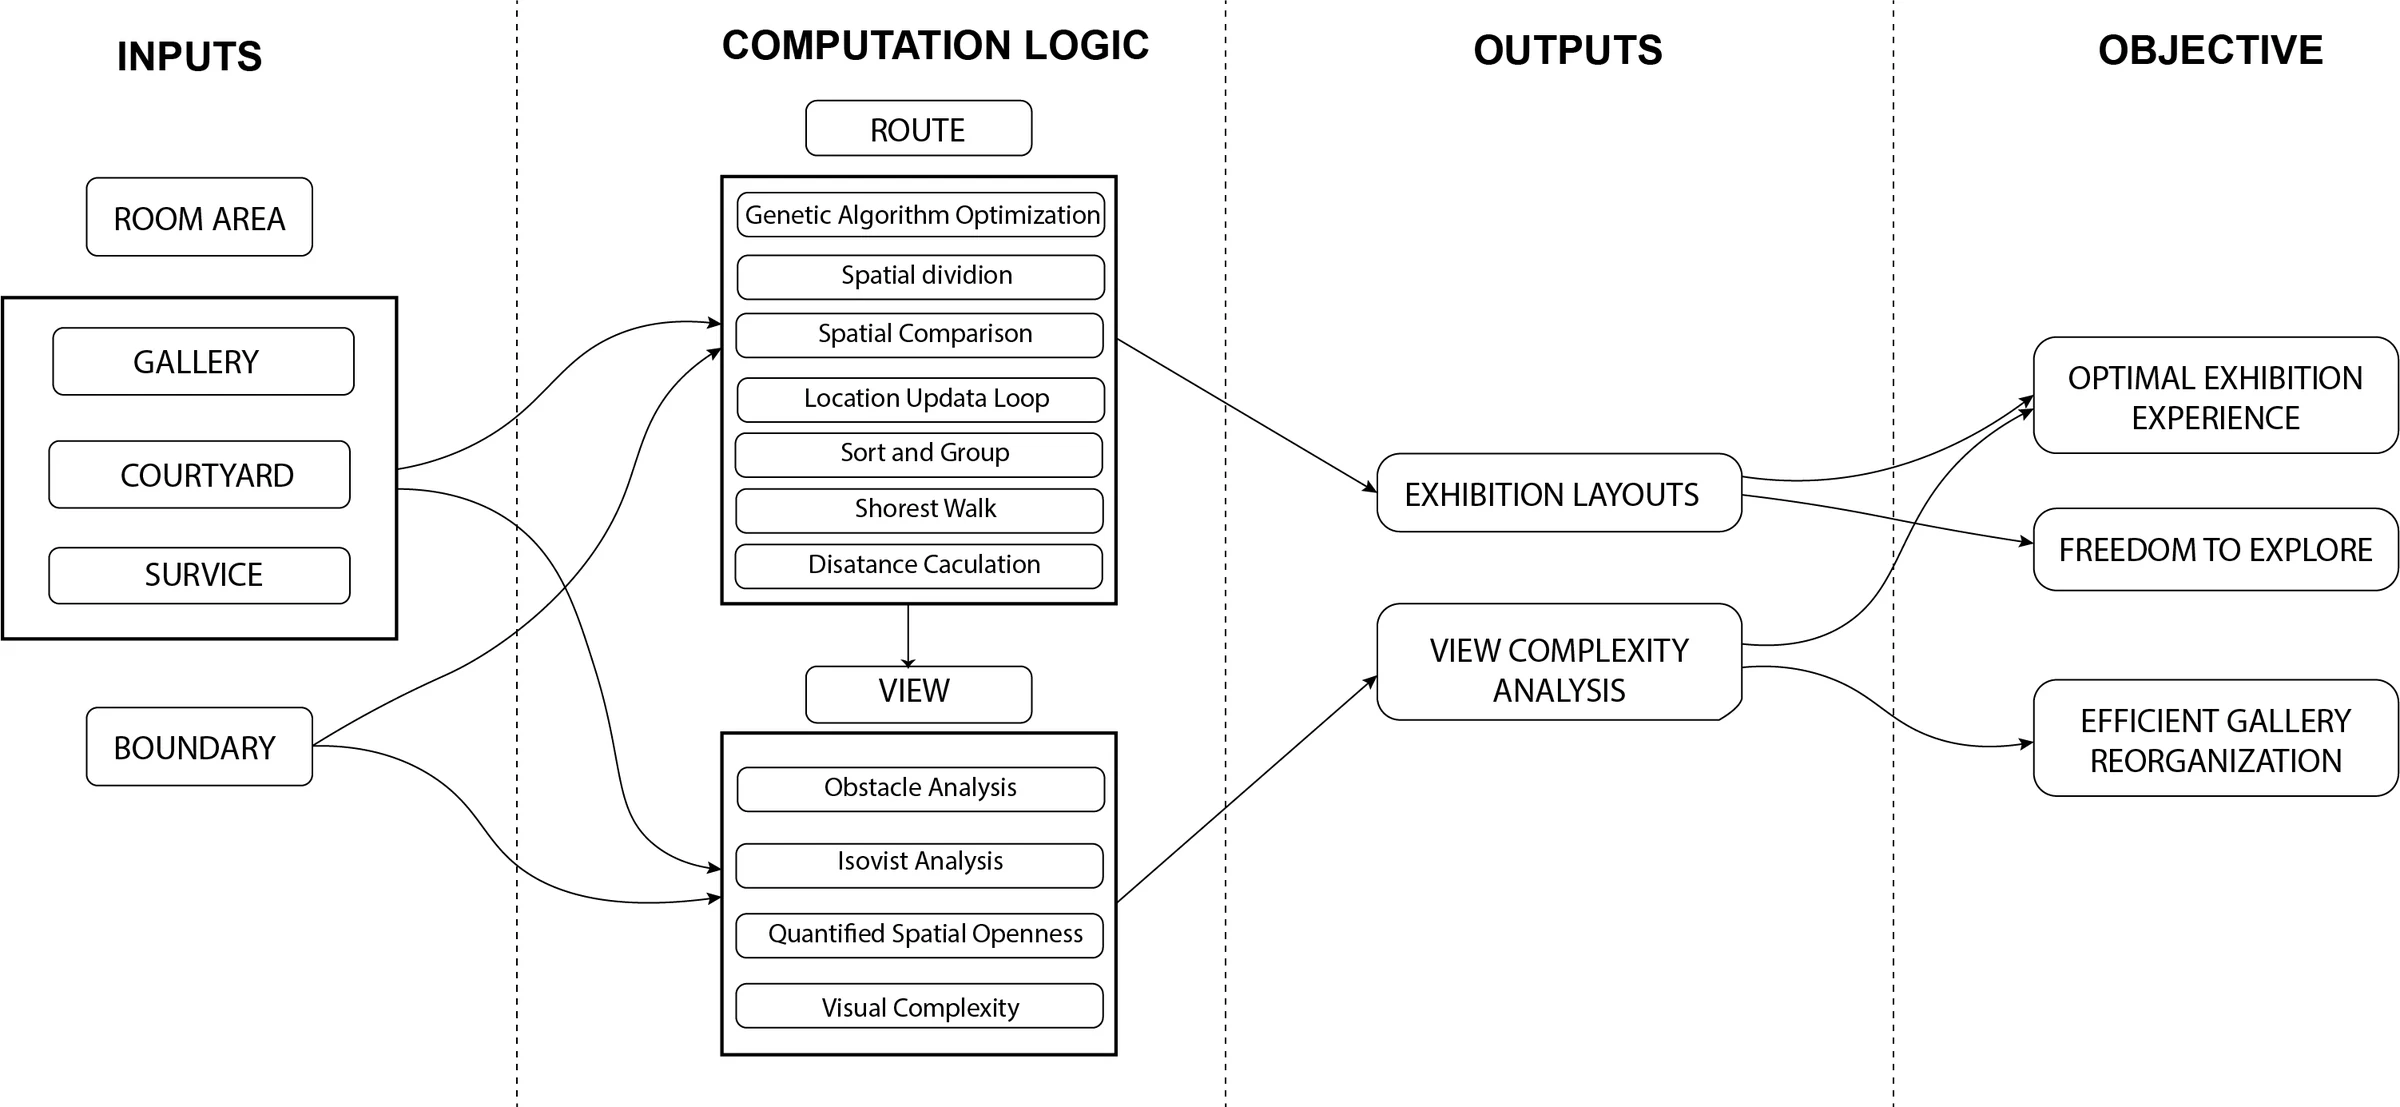
Layout, route, and view operate as one system.
Room areas, program types, courtyards, the circular boundary, and a first spatial division form the initial constraints. From those inputs, the workflow generates exhibition layouts, locates doors, recommends routes, and measures visual qualities. The output is not simply a plan: it is a set of comparable spatial propositions translated into information for both owners and visitors.
A fixed boundary produces a family of layouts.
The first divider is kept as a curator-controlled input. The model then subdivides the interior into nineteen gallery, courtyard, and service blocks and uses a genetic algorithm to compare their areas and proportions with the original program. A two-percent area tolerance limits deviation while shape ratios prevent unusable rooms. Changing one early division can therefore initiate a different, but still comparable, spatial organization.
Efficiency is suggested without eliminating choice.
Once the rooms are established, the system generates possible door locations and divides the resulting paths into walkable segments. Starting from each entrance, a Python routine repeatedly selects the nearest unvisited gallery door, removes the remaining doors associated with that gallery, and continues until every exhibition space has been reached. The four shortest complete routes become an accessibility measure for comparing layouts—not a single itinerary imposed on every visitor.
Openness and complexity become spatial evidence.
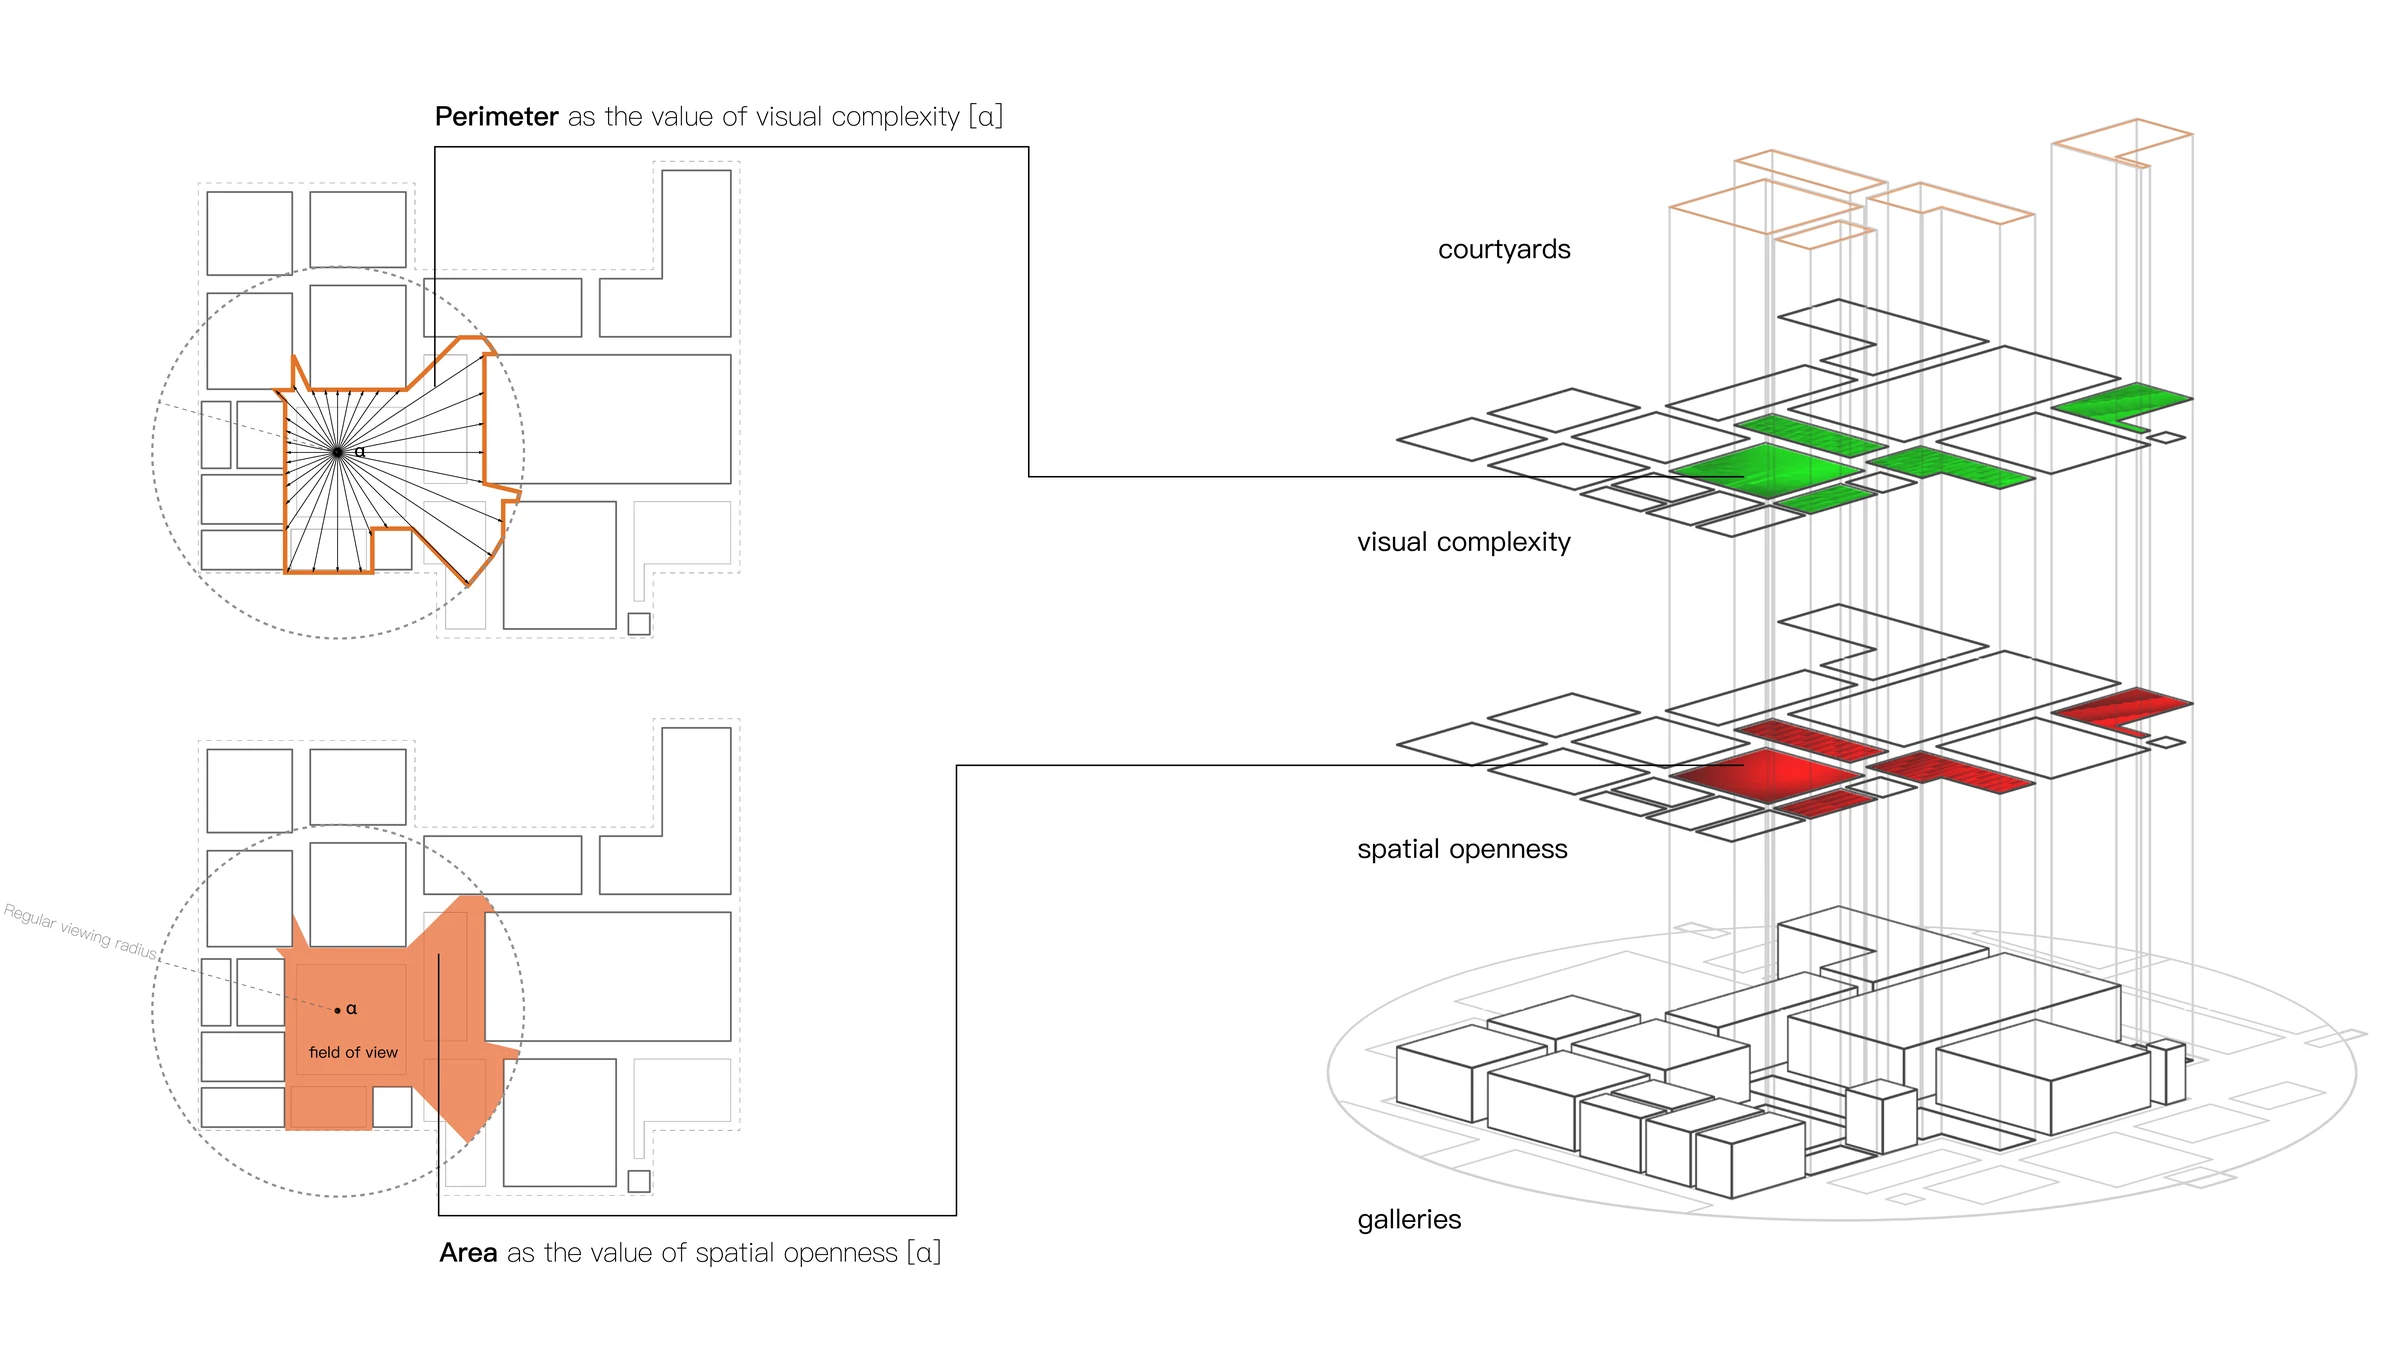
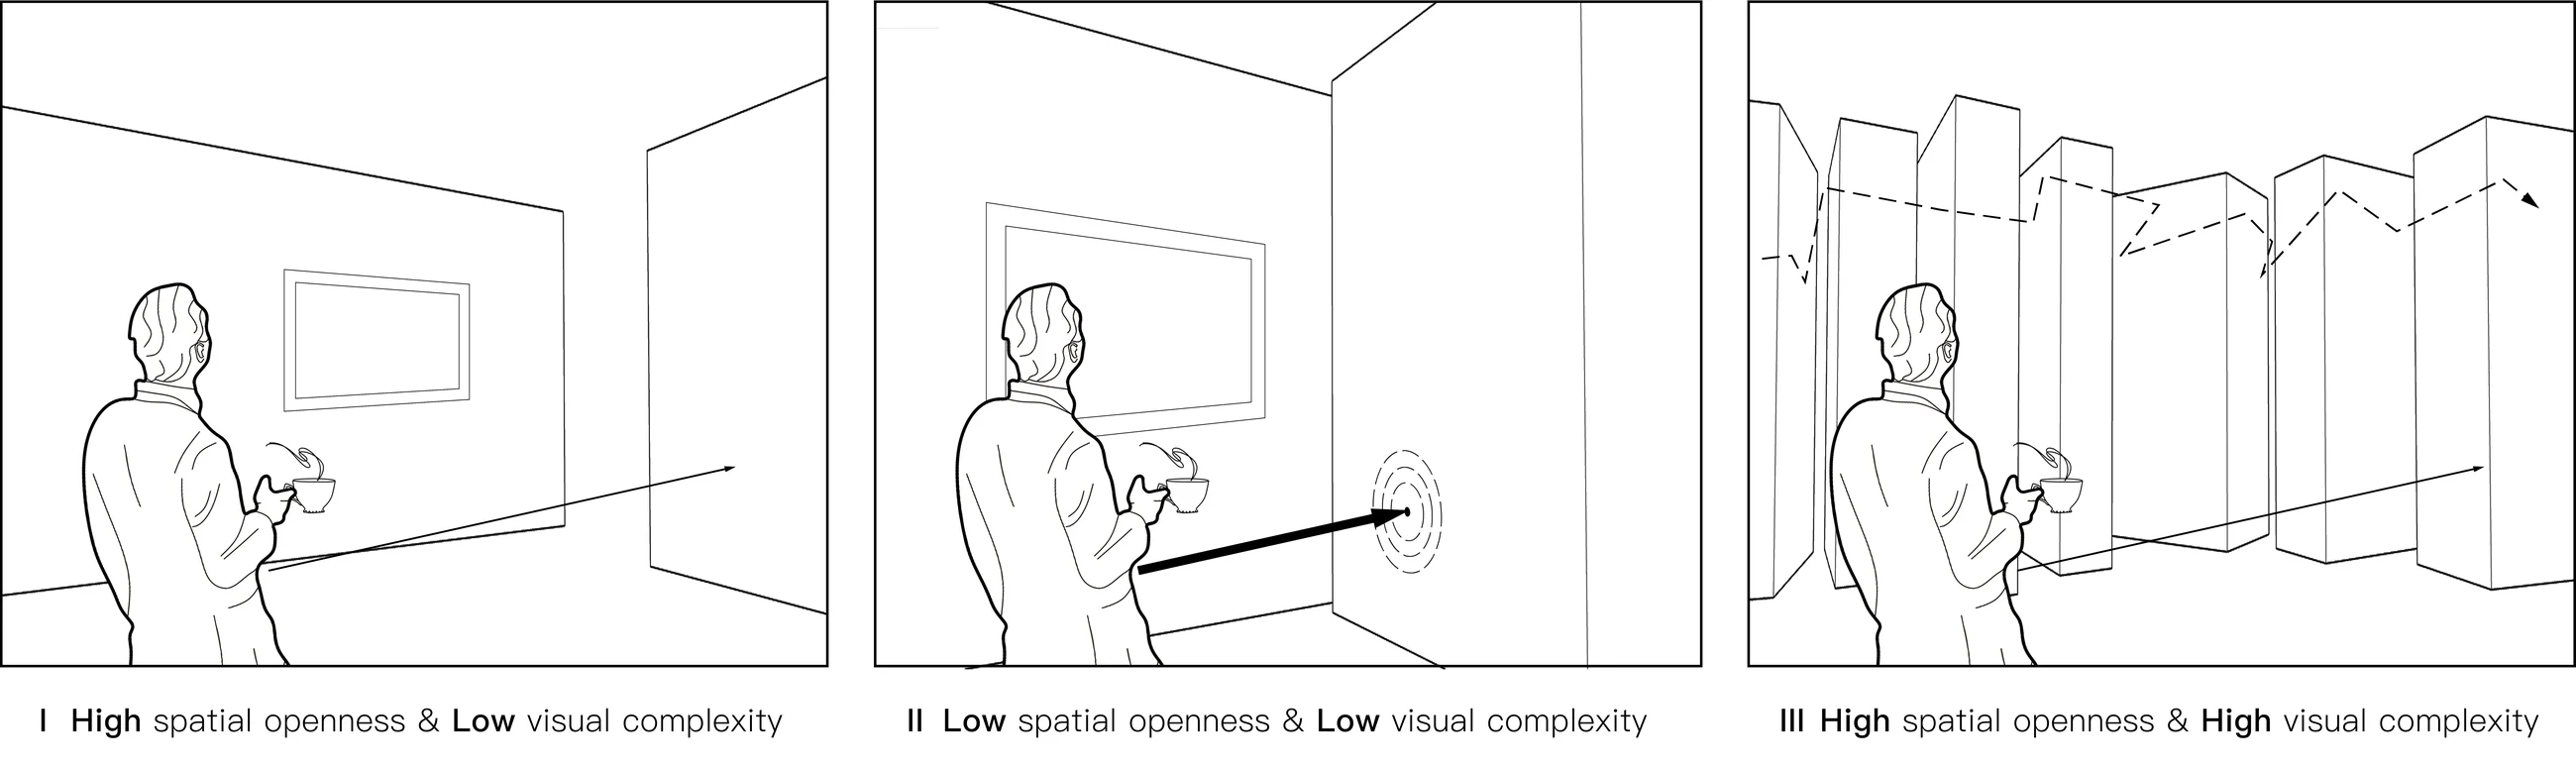
The generated plans are evaluated through their courtyards. Distributed analysis points emit rays until they meet the surrounding opaque gallery boundaries. The area of each resulting isovist is used as a measure of spatial openness; its perimeter indicates visual complexity. These values are remapped into color fields, making spatial character visible alongside route length and room-area performance.
The result is a field of choices, not one optimum.
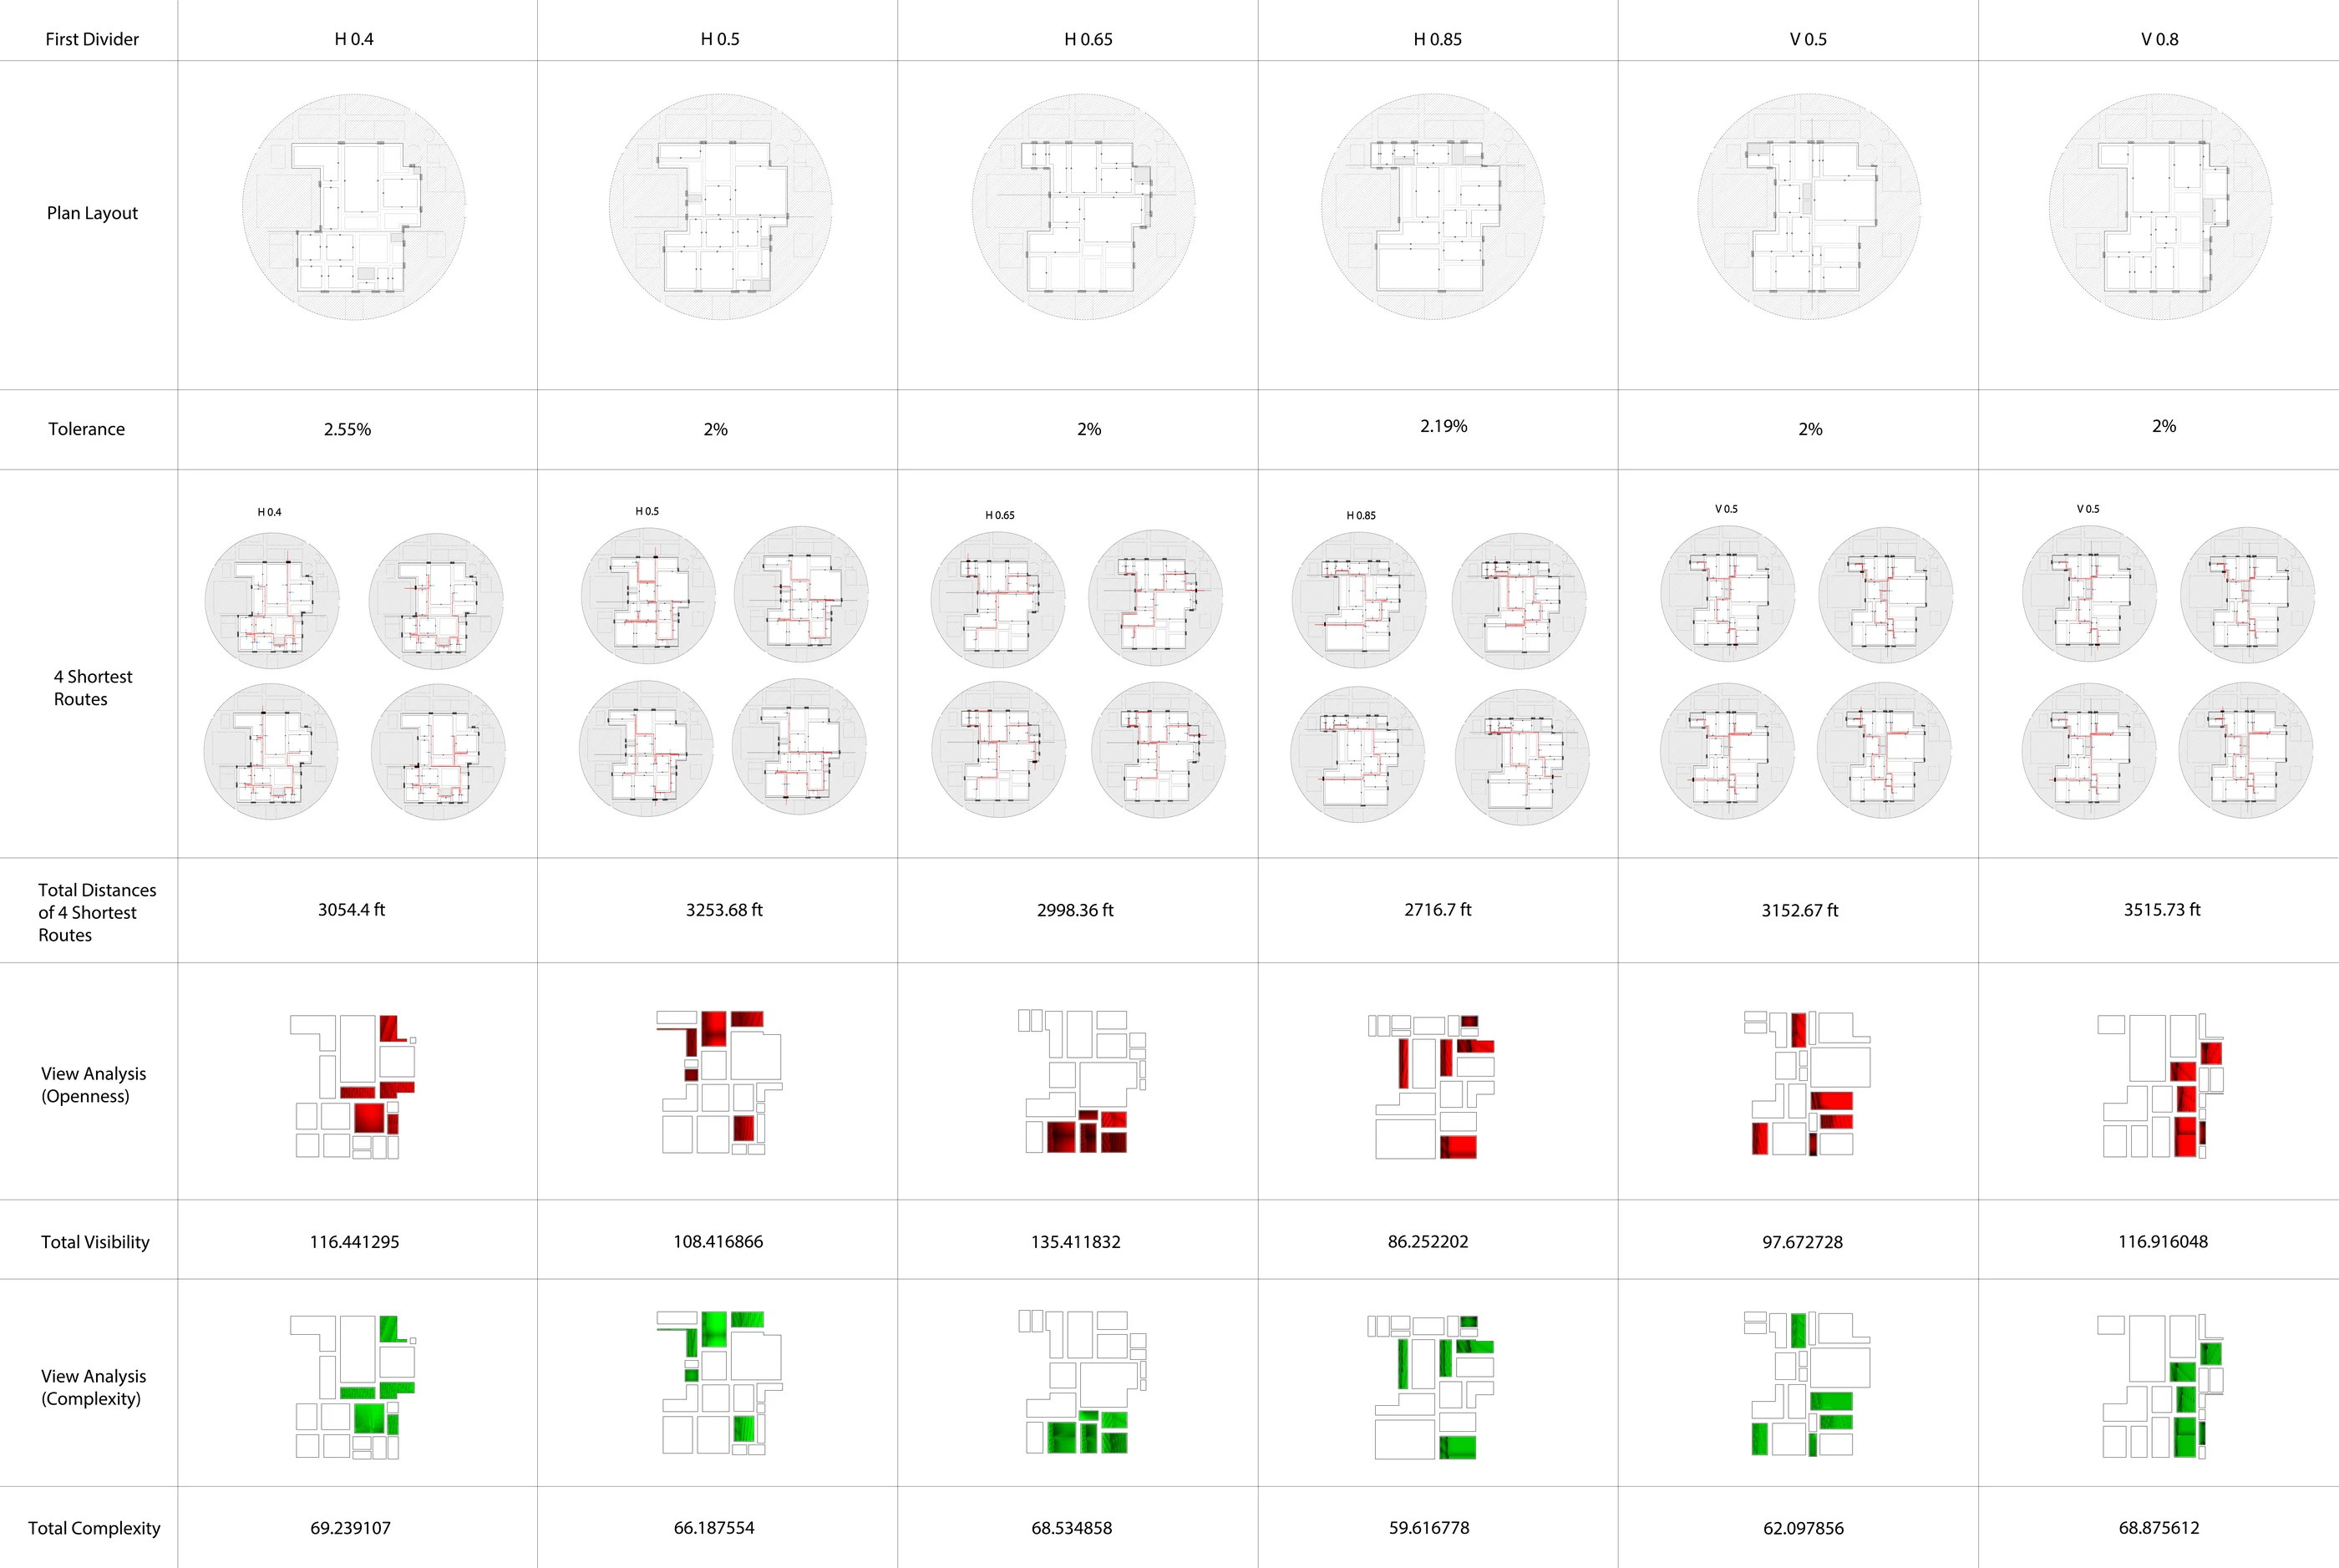
Six generated plans are placed in a common matrix. Each column records its initial divider, area tolerance, four shortest routes and their total distance, then compares quantified openness and complexity. Because every plan performs differently, the table operates as a curatorial decision surface: an owner can select a configuration according to the exhibition, desired movement, and spatial atmosphere rather than accepting a universal numerical winner.
Computation becomes usable information.
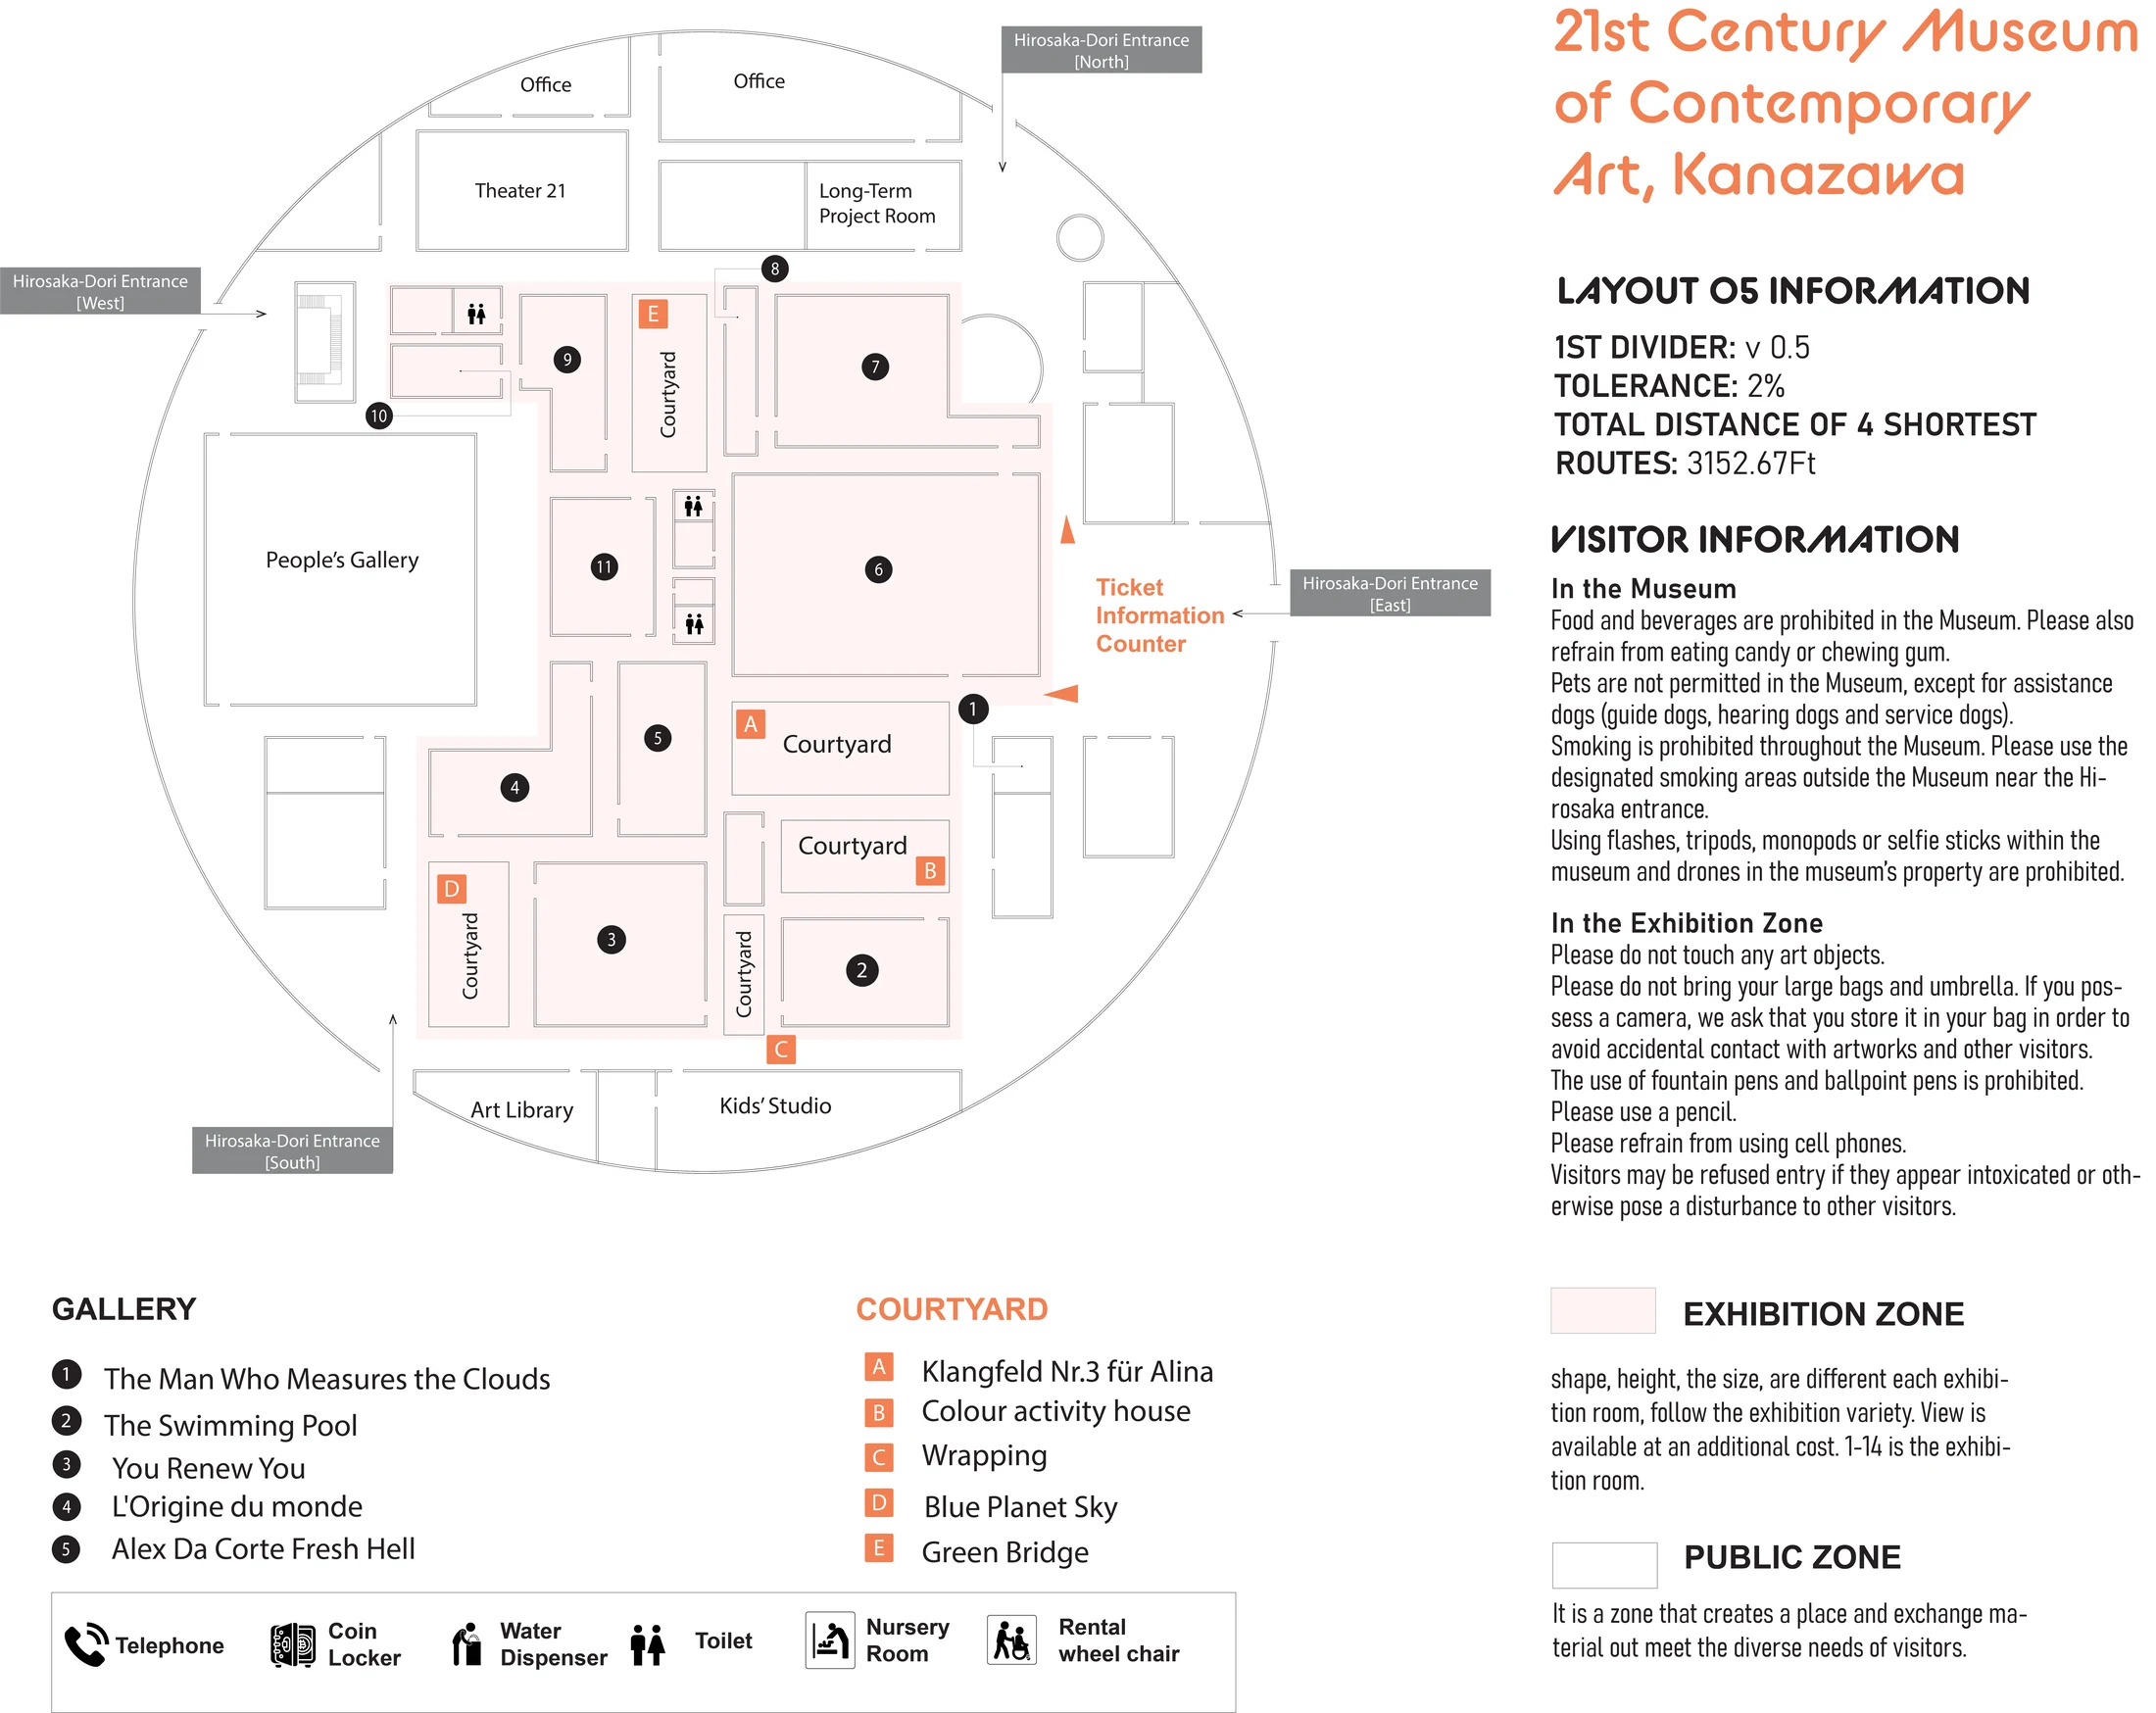
The research concludes by translating technical outputs into two interfaces. For the curator, the comparative system supports periodic gallery reorganization and different exhibition types. For visitors, a printed or digital map identifies a selected entrance, an efficient route, gallery information, and key plan metrics. The interface does not expose the entire algorithm; it turns its evidence into a legible prompt for choice.
A decision system is strongest when its limits remain visible.
The project’s central contribution is continuity: layout generation, navigation, spatial perception, and communication are treated as connected design questions rather than separate analyses. The value lies in producing a readable family of options for recurring curatorial decisions.
Shortest distance is not the same as a complete museum experience. Visitor behavior, accessibility, crowding, exhibition content, construction details, and the labor of periodic reorganization would require further observation and physical testing before the workflow could guide an operational museum.